-
Georgia Smith
- 4 Min Read
- Blog, Tracking and Analytics, Website
Understanding Website Behaviour Analytics
Website behaviour analytics can help you understand where the pitfalls lie on your website. Make informed changes and edits to your website pages by understanding the data and metrics presented to you across analytics platforms.
What are website behaviour analytics?
Website behaviour analytics or behavioural analytics focuses on collecting and combining data to help you understand how people behave on your site. This can highlight your best-performing pages and content alongside any pitfalls on your site where users lack engagement, which can be used to make informed decisions on where to improve your marketing efforts strategically.
Why do we need to understand website behaviour analytics?
By understanding behaviour analytics, you will have access to valuable insights to assess and amend any issues that appear on your website. This can help you to make data-driven decisions that ultimately lead to an improved customer experience on your website. This will significantly benefit your marketing efforts, sales strategies, and customer service by understanding how users behave on your site and mapping out the customer journeys on your website.
Your user’s digital experiences can be affected by a range of things, including SEO – Check out our blog ‘Why Use an SEO Agency for Better User Experience?’ for more information.
Key metrics to track website behaviour analytics
Google Analytics offers an engagement overview section highlighting some key engagement metrics; however, with so many platforms available, there is a range of tools you can use to gather website behaviour analytics data.
Page Views
Page Views is a high-level overview of where users are attracted to within the site. Showing you clearly which pages received the most and least views across the board and any increases and decreases over the time period.
Bounce Rate
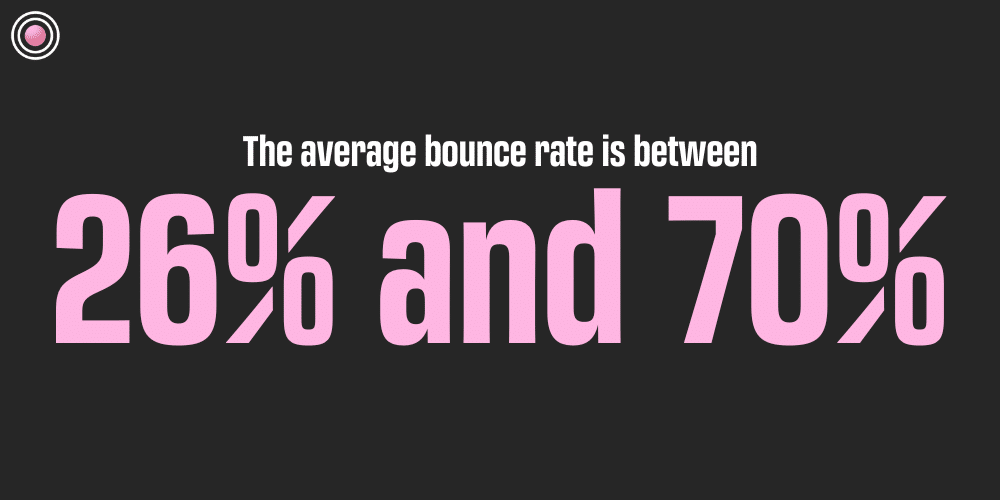
Bounce rate is the percentage of visitors that immediately leave your site after landing on a singular page. A good bounce rate can range between 26% and 40%, but the average bounce rate is between 26% and 70%. Remember, the lower, the better!
A high bounce rate can indicate a range of things, from poor page content to ranking for the wrong keywords.
To determine where the problem is, first check your keyword. Use tools to highlight the intent of users searching with that keyword. The next step is to do a classic Google search (using incognito mode). This will bring up any content, including your own, that ranks for that keyword. Check out some other ranking content and see if your content is similar or completely off.
If your keyword is spot on and you’ve got direct competitors also in the search results it may be time to review your on-page content and ask yourself a few questions.
- Are you answering all related questions?
- Have you used the keyword in the H1, intro and throughout the content?
- Have you included infographics to engage readers?
- Is the content well-written and engaging?
Average engagement time
Average engagement time highlights how long someone is engaged on your page before leaving or moving on to the next.
If you’re using Google Analytics 4, you can use the pages and screens report to see the average engagement time for each page. Ideally, some common threads you’ll see are longer engagement time on content or blog pages and less time spent on navigational pages.
Depending on your industry, the benchmark for average engagement will vary. For example, it was found that B2B industries had the highest average engagement with 1.37 minutes but on the other end of the scale, energy and grocery had the average engagement of 44 seconds per page. Make sure to check for your industry benchmark before determining how successful your site engagement is.
Conversions
Highlight and understand where people are choosing to convert on your website. Key pages like the contact and service pages should ideally be where your key conversions are coming from.
One thing you may have to work out manually is the conversion rate. You can divide your conversion rates by the number of unique users on your site within your given period. This gives you a good idea of just how many people, as a percentage, are choosing to convert in some form from your website.
Referral Sources
Find out where your users are coming from other than direct, organic and paid channels. With the user acquisition report, you can see where users came from by channel, but if you add the session source / medium filter, you can see which pages they came from. This can help you determine how qualified the traffic coming from these pages is.
Our final thoughts
- Website analytics are crucial for gaining deeper insights into the user interactions that occur on your website.
- Website behaviour analytics show you the full user journey and allow you to understand how users interact with your site.
- Page views can show you your most and least popular pages across the site.
- The bounce rate shows the percentage of users leaving the site after visiting only one page.
- Engagement time can show you how effective your on-page content is.
- Conversions will show your conversion rates and which pages users choose to convert on.
- Referrals show you where users are coming from outside of the typical channels.
The key to regularly assessing your website’s user behaviour analytics is to gain actionable insights to create a stronger online presence and promote customer satisfaction on your website.
Don’t let valuable data go to waste. Contact ROAR and discover how our Website Tracking and Analytics Services can help you uncover hidden opportunities, boost your marketing strategies and drive growth for your business.


