

Google Analytics 4 offers valuable information about how users interact with your website. A Google Analytics website audit can provide deeper insight into Google Analytics 4 as a tool and how your website performs to make strategic business decisions and reach your business goals.
Running a Google Analytics Website Audit
A website audit allows you to dive deeply into the performance of your website, highlighting its negative and positive performance. It provides actionable insights into your website, which is performing well online, and any areas that require improvements to improve sales, online visibility, user experiences on your website, etc.
71% of businesses have a website, which makes the online space massively competitive. A Google Analytics website audit can help you identify needed improvements to set you apart. Google Analytics 4 connects to your site and pulls through data as visitors use your site. It pulls data on engagement, pages, acquisition, location and more.
Setting Up Google Analytics
Connecting your website to Google Analytics 4 should be an easy process.
First and foremost, you need a Google Tag Manager and Google Analytics 4 account. Tag Manager offers you the most efficient way to connect Google Analytics 4 to your website.
Next, you create your analytics property, providing all of the details along the way. Then, add your data stream.
Check out our previous blog for in-depth steps to connect your website to Google Analytics 4.
Audit Objectives
Now that you understand Google Analytics and how to find what you’re looking for. Set clear objectives of what you’re looking to get from your website audit. Is there an issue that you need to find the source of? Are you just trying to gain clarity on where your suite is at? Either way, set objectives that cover exactly what you’re thinking.
At this point, you can also pick out the KPIs you will track from now into the future consistently.
Basic Website Metrics
Initially, you want to analyse the overall website traffic. This includes how many users and which pages they viewed.
In Google Analytics 4, you can see the users on the Homepage Dashboard, with a dropdown just below the graph; you can change the time period that the graph and stats cover.
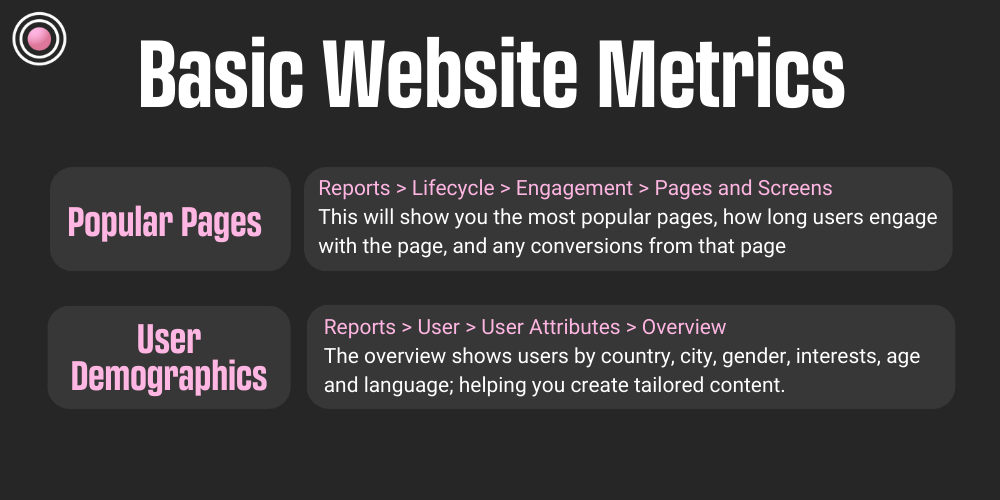
By heading to Reports > Lifecycle > Engagement > Pages and screens, you can see which pages your users visit most frequently.
At this stage, you should also cover your user demographics. Go to the Reports toolbar > User > User Attributes > Overview.
The User Attribute report shows users by country, city, gender, interests, age and language. This data can come in extremely useful when it comes to tailoring your content for your demographics specifically.
Examining Lots of Traffic Sources
One of the great things about website analytics is that you can use it to assess various traffic channels and how they perform for your business.
By examining your traffic sources, you can see which marketing channels are performing and bringing people to the website.
Head to Reports > Lifecycle > Acquisition > Traffic Acquisition to discover which channels users came from. This report breaks down which channel group your users came to your site from. Consider whether your users come from direct traffic, organic traffic, social, referral, or paid channels.
The breakdown of channels can include Organic Search, Direct, Referral, Organic Social, Unassigned, Paid Social and Display. The channels displayed within your report depend on which channels you are running for your business.
Analysing User Engagement
To review user engagement, visit Reports > Lifecycle > Engagement > Overview. The overview will cover engagement data at a top level with independent reports for each section for you to dive deep into the data you need.
The initial data on the overview page includes average engagement time, engaged sessions per user, and average engagement time per session. Each of the three stats is paired with a graph showing the daily breakdown over your selected time period.
You can also see the event count by event name breakdown and your views by page title. With these reports, you can see what users are doing on your site and which pages they are visiting while they’re on your site.
Consider reviewing the bounce rate of your audience in Google Analytics 4 when it comes to putting your website audit report together.
Conversion Analysis
Within the engagement section, you can access conversion tracking, where you can see your conversion rate and better understand user actions, how they engage with your website and where they convert the most. Are they completing purchases the most? Contact form submissions? Making phone calls?
This information clarifies how users choose to contact and engage with your business. This is useful if you have the same conversion points but on multiple pages to see exactly where those are.
Advanced Google Analytics Features
If you head to the explore tab of Google Analytics 4, you’re presented with various templates to explore specific data.
You can look into user journey, lifetime and segmentation to discover more about your website and your users simultaneously.
Another advanced feature is to add custom events and conversions through Google Tag Manager.
By opening Google Tag Manager and selecting ‘GA4 Event’ as the tag type, add your GA4 Configuration Tag and select the parameters you need for specific event tracking on your website.
Once you’ve published your container, go back to Google Analytics 4 and add your custom event to the events section within admin. Once your event is added, you can tick it as a conversion. This means it will then show up as a conversion action in your reports.
Regarding the more advanced features, there is plenty of help and step-by-step guides from users, and Google themselves have the Analytics Help Centre to help with your technical questions.
Next Steps
Once you’ve completed your Google Analytics Audit, you must compile your findings into a comprehensive report to easily and effectively make necessary changes to improve your online performance and reach your business goals.
Split your changes between your site and Google Analytics 4, making your life much easier down the line as you start to action the changes. Any site and content changes can go to your content team and Google Analytics changes with your SEO.
Our Website Analytics and Tracking Services allow your business to unlock valuable insights about your website performance and help you reach your business goals. Learn more here!